Richest Counties in Minnesota (2025)
by Kristen Carney ![]()
Updated: December 17, 2024
Richest County in Minnesota
The richest county in Minnesota is Carver County with an average household income of $154,466 as of 2023 and 111,057 people as of 2023 according to the most current Census data available (citation).
| Rank | County | Population | Average Income | Median Income |
|---|---|---|---|---|
| 1 | Carver County | 111,057 | $154,466 | $123,144 |
| 2 | Scott County | 155,814 | $150,088 | $120,247 |
| 3 | Washington County | 278,936 | $148,315 | $114,457 |
| 4 | Hennepin County | 1,258,713 | $135,302 | $96,339 |
| 5 | Dakota County | 447,440 | $129,420 | $105,212 |
| 6 | Olmsted County | 164,784 | $128,162 | $93,494 |
| 7 | Wright County | 151,150 | $123,045 | $106,666 |
| 8 | Sherburne County | 102,206 | $121,697 | $102,965 |
| 9 | Anoka County | 372,441 | $116,995 | $98,764 |
| 10 | Dodge County | 21,088 | $113,969 | $92,943 |
| 11 | Chisago County | 58,535 | $113,914 | $98,260 |
| 12 | Ramsey County | 536,075 | $110,836 | $81,004 |
| 13 | Nicollet County | 34,242 | $109,919 | $80,362 |
| 14 | Le Sueur County | 29,255 | $107,148 | $90,218 |
| 15 | Rice County | 67,948 | $104,482 | $82,792 |
| 16 | Stevens County | 9,728 | $103,377 | $71,060 |
| 17 | Steele County | 37,421 | $101,912 | $83,448 |
| 18 | Isanti County | 43,182 | $101,811 | $86,573 |
| 19 | Goodhue County | 48,035 | $100,638 | $82,749 |
| 20 | Douglas County | 39,953 | $99,168 | $77,264 |
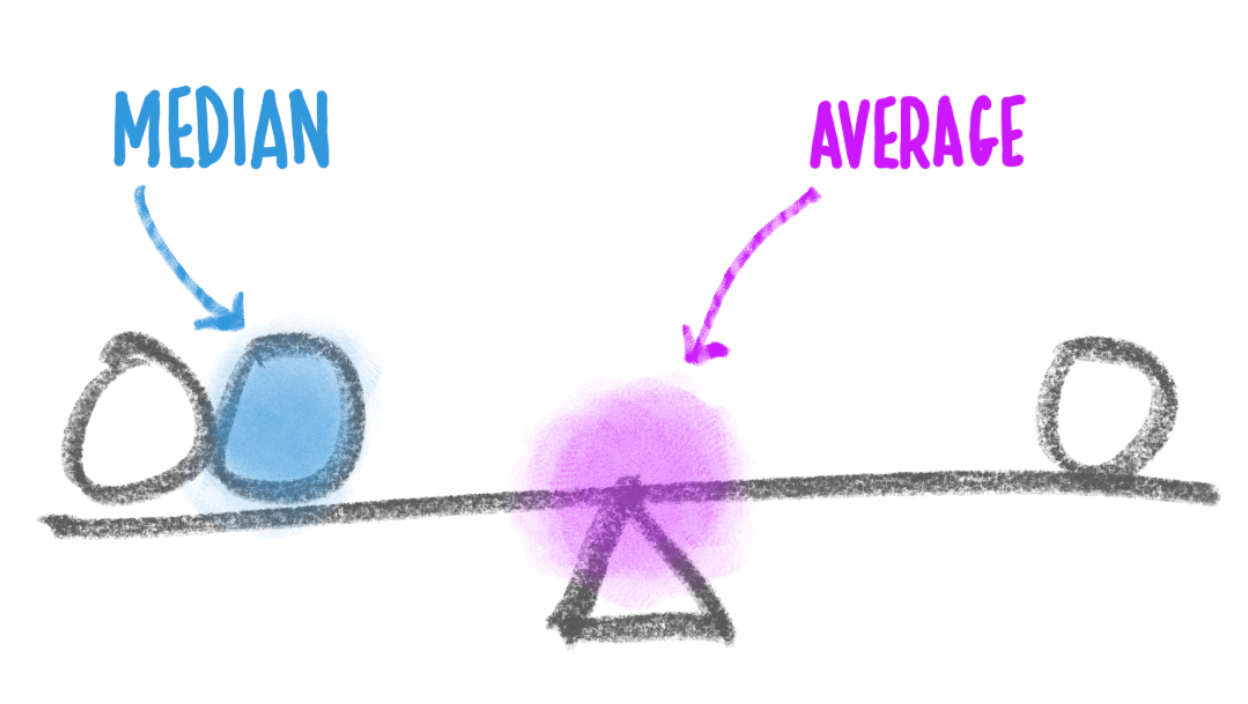
Median Income versus Average Income: Which Should You Use?
We usually suggest using median income data – either instead of or in addition to – average income data as a true indicator of wealth. If you haven’t thought about median versus average since your last standardized test, you aren’t alone. Here’s what they are:
- average is the sum of a set of numbers divided by the count of numbers in the set
- median is the middle number in the set of numbers
Now let’s say you had the following simplified set of income data.
Household 1: $30,000
Household 2: $50,000
Household 3: $1,000,000
The average income for this set is $360,000. The outlier data point ($1,000,000) skews the average WAY up. Conversely, the average income would be skewed WAY down if someone had an income of $500. The median income for the same data set is $50,000. Outlier data doesn’t skew the median.
Most Business Owners Should Use Median Income
So most business owners should use the median income as a true indicator of wealth, because it provides a more accurate representation of a typical income, especially in areas with significant income disparity.
When Should You Use Average Income
If your target market is high-income households, the average income may be more relevant. This is because the average income can highlight the presence of a higher concentration of wealthy individuals, which is beneficial for luxury goods and services marketing. We’re using average income on this page because using the Census’s highest reported median value of $250,001 could result in multiple ties for the richest geography.
Why do so many cities have a median value of $250,001?
The Census' American Community Survey uses $250,000+ as a jam value for median income estimates to protect privacy, ensure data consistency, and simplify reporting. A "jam value" in survey data refers to a placeholder or default value used when actual data points are unavailable, incomplete, or exceed certain thresholds. We represent this jam value as $250,001 to make it easy for you to sort.
You might also be interested in:
Email Me When New Data Are Released
Join thousands of subscribers and receive just 1 (ONE!) email a year in December when the US Census Bureau releases new income data for Minnesota richest counties.
SOURCES
United States Census Bureau. Annual Estimates of the Resident Population: April 1, 2020 to July 1, 2023. U.S. Census Bureau, Population Division. Web. May 2024. http://www.census.gov/.
United States Census Bureau. B01001 SEX BY AGE, 2023 American Community Survey 5-Year Estimates. U.S. Census Bureau, American Community Survey Office. Web. 12 December 2024. http://www.census.gov/.
United States Census Bureau. B19013 Median Household Income, 2023 American Community Survey 5-Year Estimates. U.S. Census Bureau, American Community Survey Office. Web. 12 December 2024. http://www.census.gov/.
United States Census Bureau. “DP03 SELECTED ECONOMIC CHARACTERISTICS.” 2023 American Community Survey 5-Year Estimates. U.S. Census Bureau, American Community Survey Office. Web. 12 December 2024. http://www.census.gov/.
Products & Services
Plumbing
Connect
- 1-800-939-2130
- Contact Us
© Copyright 2025 Cubit Planning, Inc.